HP48:
 [STAT]
 [STAT]
Including: Single Var, Fit Data and Summary Statistics.
Syntaxes and operations are the same for HP48 and HP49.
| Keyboard access HP48: [STAT]
|
| HP49: [STAT] |
[STAT]||Single-Var||
|
Keyboard access:
[STAT]||Summary stats||
| ||||||
Keyboard access:
[STAT]||Fit data||
|
||||||||||||||
Best Fit is the Fit with correlation, in absolute value, closest to 1.
You can know the value of X for a given value of Y
or vice-versa using PRED into FIT DATA function.
Choose the type of FIT and press PRED. in menu, fill out the fields for
X or Y and press PRED and the calculator will give you the result.
To  DAT: [[1 5][3 3] [ 7 2] [9 6] [3 8] [2 6]]
we have:
X: 25.0952380951 Y:2
X: 5.5 Y:4.80887372013
Where the red numbers are the ones we give to the calculator to predict the value
and the bold black numbers the result.
Press EDIT, in menu to see the number in full standard format (12 digits).
Standard Deviation and Mean for Group Data can easily be solved with the help of a little program.
These are the formulas for standard deviation and mean for group data.
Standard deviation of a group data, for a sample 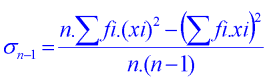
|
Mean for a group data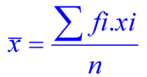
|
| Where xi is the sample and fi the frequencies | |
The program
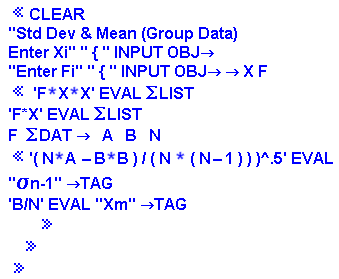 |
You need runs the program an type a list of numbers with a space between the elements of the list. For example { 2 3 4 5 6 7 For the group of data: Xi: 2 3 4 5 6 7 Fi: 12 13 14 15 16 17 it should returns Mean: 4.70114942529 Std dev: 1.6959379633 |