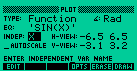
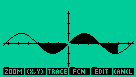
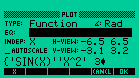
Plot Application
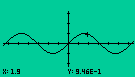
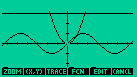
Plot of Y=sin(x)
Press (X,Y) move the cursor up or down,
left or right to see its position on the screen.
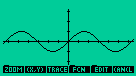
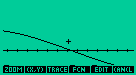
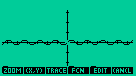
Press [TRACE] and (X,Y), move the cursor
left or right to see its position on the line.
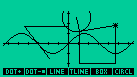
First move the cursor to a point of the screen
so press [ZOOM] [BOXZ] and draw a box.
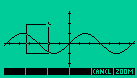
to see the result.
Use [ZDFLT] to set the plot to the default zoom.
Press [ZOOM] [ZIN]
to see the plot bigger
Press [ZOOM][ZOUT]
see the plot smaller
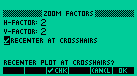
Zoom factor permits you adjust the zoom magnifying factor.
Press [ZOOM][ZDFLT] to set the zoom factor.
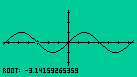
To find a root of an equation set the cursor
at the point closest to the root you wish find.
And so press [ FCN ] [ROOT]
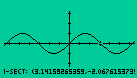
To find the intersection of two equations go with the cursor
to a point closest to the intersection.
And so press [ FCN ] [ISECT]
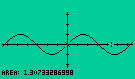
We need define two points on the X axe to calculate the area.
First move the cursor to the first point and press
[ FCN ] [AREA]
and then move the cursor to the second point and press
[AREA]
We need define two points on the X axe to shadow a plot.
First move the cursor to the first point and press
[ FCN ] [SHADE]
and then move the cursor to the second point and press
[SHADE]
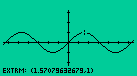
To find the extrem point of a plot function,
plot the function and press [ FCN ] [EXTRM]
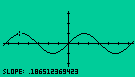
To find the slope at a given point of a curve, first move
the cursor to a point on the curve and press [ FCN ] [SLOPE]
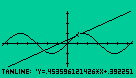
To find a stright tanline that passes for a given point of a plot,
move the cursor to a point on the curve and press [ FCN ] [TANL]
This function plots a second plot,
i.e. the plot of the derivative of the original plot.
Draw the plot of a function and
press [ FCN ] [F']
to execute
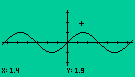
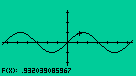
This function calculates the value of y=f(x).
Move the cursor to a point in the screen and
press [ FCN ] [F(x)]
to see the value of the function, in the point.
Enter a list of expressions delimited
by an apostrofe in the EQ field
to plot several functions.
Example:
{'sin(x)' 'x^2' '3' }
of all functions.
Pressing [EDIT] [LABEL] you can see
the coordinates in the screen.
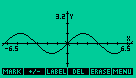
Pressing [EDIT] you can draw lines,
circles and boxes, erase lines and paint.