Using SCATTER plots it is possible to plot a set of points
|
Example:
Lets plot the set of points
|
|
|
1-Access PLOT Application:
Press  2D/3D 2D/3D
Press
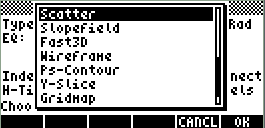
[CHOOSE]
and switch plot to
SCATTER
|

|
|
|
2 - At the SCATTER PLOT environment
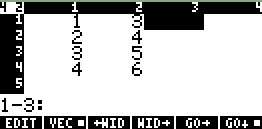
type the matrix of points.
Press [EDIT], in the menu,
and  [MTRW] [MTRW]
to access EQUATION WRITER
So, enter the matrix of points.
|

|
|
|
3 - Press [ENTER] and [OK]
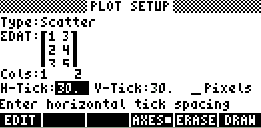
The matriz will apear as  DAT DAT
at PLOT environment
4 - Uncheck Pixels
5 - Set
H-View :30
V-View:30
|

|
|
|
6-Press
[ERASE] [DRAW]
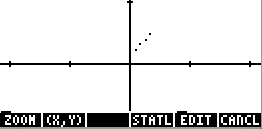
to see the plot
7-Press
[STATL]
to see the line that passes for the points.
|

|
|
|